


Transaction tracing is one of the most critical capabilities in Web3 infrastructure. If you operate an indexer, run a block explorer, execute MEV strategies, or build automated DeFi accounting systems, standard transaction receipts only scratch the surface. You need internal transaction execution trees, nested contract invocations, precise state diffs, and low-level VM opcodes to understand what happened during execution.
For years, the go-to solution across the Polygon ecosystem was running Polygon Erigon archive nodes. Erigon natively exposed the Parity and OpenEthereum style trace_* RPC namespace. Teams structured entire data pipelines around methods like trace_block, trace_transaction, and trace_replayBlockTransactions.
As teams started planning migrations toward Bor, the primary execution client for Polygon, they hit an operational wall. Bor provided Geth-style debug_trace* endpoints, but lacked native trace_* methods. That meant developers either had to run custom translation middleware or rewrite their indexing ingest pipelines from scratch.
To solve this problem for our customers and eliminate migration friction across the ecosystem, Tom Meinlschmidt, Infrastructure Engineer at Tatum, spent months developing native Parity trace support directly inside Bor. Working alongside Polygon core contributors including Pratik Patil and Adam Dossa, the work was contributed upstream and merged into Bor in PR #2294.
Here is a technical walkthrough of how the tracing engine was constructed, how we validated 96% parity against live Erigon archive nodes, and how operators can enable it today.
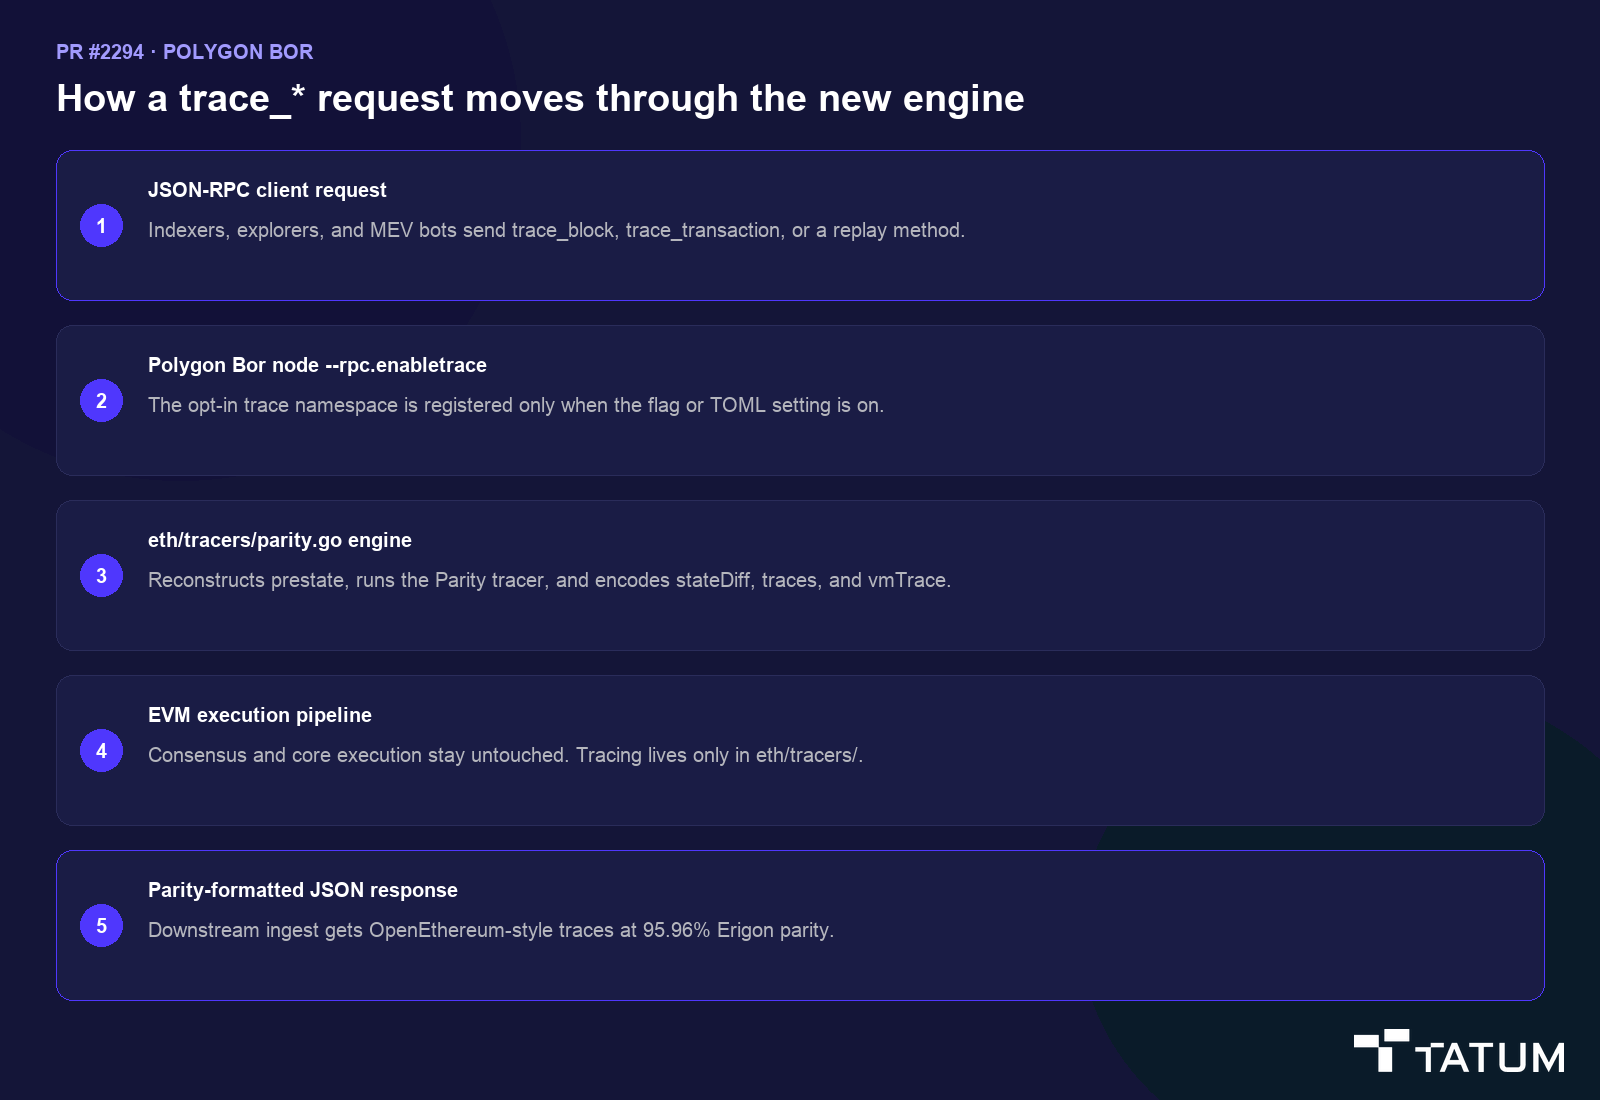
PR #2294 · Polygon Bor
How a trace_* request moves through the new engine
JSON-RPC client request
Indexers, block explorers, MEV bots, and data APIs send trace_block, trace_transaction, or a replay method.
Polygon Bor node --rpc.enabletrace
The opt-in trace namespace is registered only when the flag or TOML setting is on. Consensus and standard RPC routes stay untouched.
eth/tracers/parity.go engine
- Reconstructs historical prestate via HookedState
- Runs the Parity call tracer and hooks OnGasChange
- Calculates Bor base fee burn and recipient contract balance
- Encodes stateDiff (+ / - / *), trace trees, and vmTrace ops
EVM execution pipeline
Standard consensus and core execution remain untouched. Tracing lives exclusively in eth/tracers/.
Parity-formatted JSON response
Downstream ingestion receives OpenEthereum-style traces at 95.96% byte-identical parity with live Erigon archive nodes.
The challenge: why debug traces were not enough
While Polygon Bor offered debug_traceCallMany and individual debug tracers, the data structures returned by Geth-style tracers differ significantly from the OpenEthereum standard.
Parity traces structure execution as an ordered hierarchical action tree. They cleanly separate root gas and sub-call limits, provide granular account state modifications through stateDiff, and output step-by-step opcode listings inside vmTrace.
For analytics platforms processing millions of historical calls, converting raw Geth debug outputs to Parity formats on the client side introduces substantial CPU overhead and latency. Adding native support directly into Bor's RPC layer ensures that node operators can switch execution clients without altering a single downstream query.
That matters even more as Polygon Erigon approaches end of life. Polygon Labs sunsets the 0xpolygon/erigon implementation on Polygon PoS, and Tatum is migrating archive infrastructure to Bor with Path-Based State Scheme. Native trace_* support is what lets indexers keep their existing ingest contracts instead of rewriting them around debug_trace*.
Response schema
Geth debug traces vs Parity trace_* payloads
| Schema field | debug_trace* | trace_* |
|---|
Click a row to highlight the schema difference. Parity traces are what most Polygon indexers already consume.
Under the hood: building the tracing engine
PR #2294 introduced a dedicated, opt-in trace namespace inside eth/tracers/ spanning more than 5,000 lines of code. The implementation delivers six core RPC methods and all three Parity trace types: trace, stateDiff, and vmTrace.
The new code is isolated to the RPC layer. debug_traceTransaction, eth_call, block production, and state transition are byte-for-byte unchanged. The namespace is not registered unless --rpc.enabletrace is set, so existing nodes are unaffected.
JSON-RPC schema
Six trace_* methods, with request and response fields
Request
| Field | Type | Notes |
|---|
Response
| Field | Type | Notes |
|---|
Select a method above to inspect its request and response schema. The six methods cover mined-transaction tracing, configurable replays, and simulated calls:
trace_block: Returns Parity-format traces for every transaction in a block.trace_transaction: Generates the call trace tree for a specific mined transaction.trace_replayTransaction: Replays a transaction and returns configurable outputs includingtrace,stateDiff, andvmTrace.trace_replayBlockTransactions: Iteratively replays an entire block, generating trace and state diff outputs per transaction.trace_call: Executes a transaction call against a given block state without broadcasting it.trace_callMany: Batches multiple call simulations in sequence with shared state evolution, bounded to 100 entries per call.
Trace types
Parity output schemas: trace, stateDiff, and vmTrace
| Field | Type | Meaning |
|---|
Preserving Polygon-specific semantics
Porting Parity tracing to Bor required addressing several Polygon architectural details that do not exist in standard Ethereum execution environments.
Bor-specific accounting
Schema details that Geth tracers do not encode for you
| Polygon detail | What the engine does | Where it lands in the schema |
|---|---|---|
| Base fee burn | Polygon routes base fees to a designated burnt contract. The tracer calculates that address from the target block number and records the balance shift. | stateDiff[burnAddress].balance |
| Gross execution gas | Root call gas equals the transaction limit minus intrinsic gas. gasUsed is gross consumption before refunds. A custom OnGasChange hook wraps native callTracer. |
action.gas / result.gasUsed |
| Precompile filtering | Active precompiles vary across hard forks. Inactive precompiles are filtered so false empty subcalls do not appear in the tree. | subtraces / call tree |
| Isolated RPC layer | All tracing logic runs exclusively in eth/tracers/. Consensus, block production, debug_*, and eth_call remain untouched. |
No consensus schema change |
Base fee burn accounting. Standard prestate tracers do not automatically track Polygon's internal credit to the burnt contract. The implementation records that balance shift in the generated stateDiff.
Gross execution gas calculations. In Parity tracing, root call gas equals the transaction limit minus intrinsic gas, while gasUsed represents gross consumption prior to refunds. The engine wraps the native call tracer with a custom OnGasChange hook to intercept the exact gas remaining before refund operations occur.
Precompile filtering. Active precompiles vary across hard forks. The tracer filters inactive precompiled contracts to prevent false empty subcalls from appearing in the output tree.
Isolated RPC layer. All tracing logic runs exclusively in eth/tracers/. The consensus engine, block production code, and standard RPC routes remain completely untouched.
The testing campaign: 520 mainnet samples
To ensure reliability, the implementation was tested against live Polygon Erigon v3.3.7 archive infrastructure provided via Chainstack. An automated validation suite evaluated 520 randomly sampled blocks across the entire history of Polygon PoS mainnet, comparing outputs byte for byte.
Every mined-transaction method achieved 100% byte-identical parity. Combined across all six methods, 499 of 520 responses matched exactly: 95.96%.
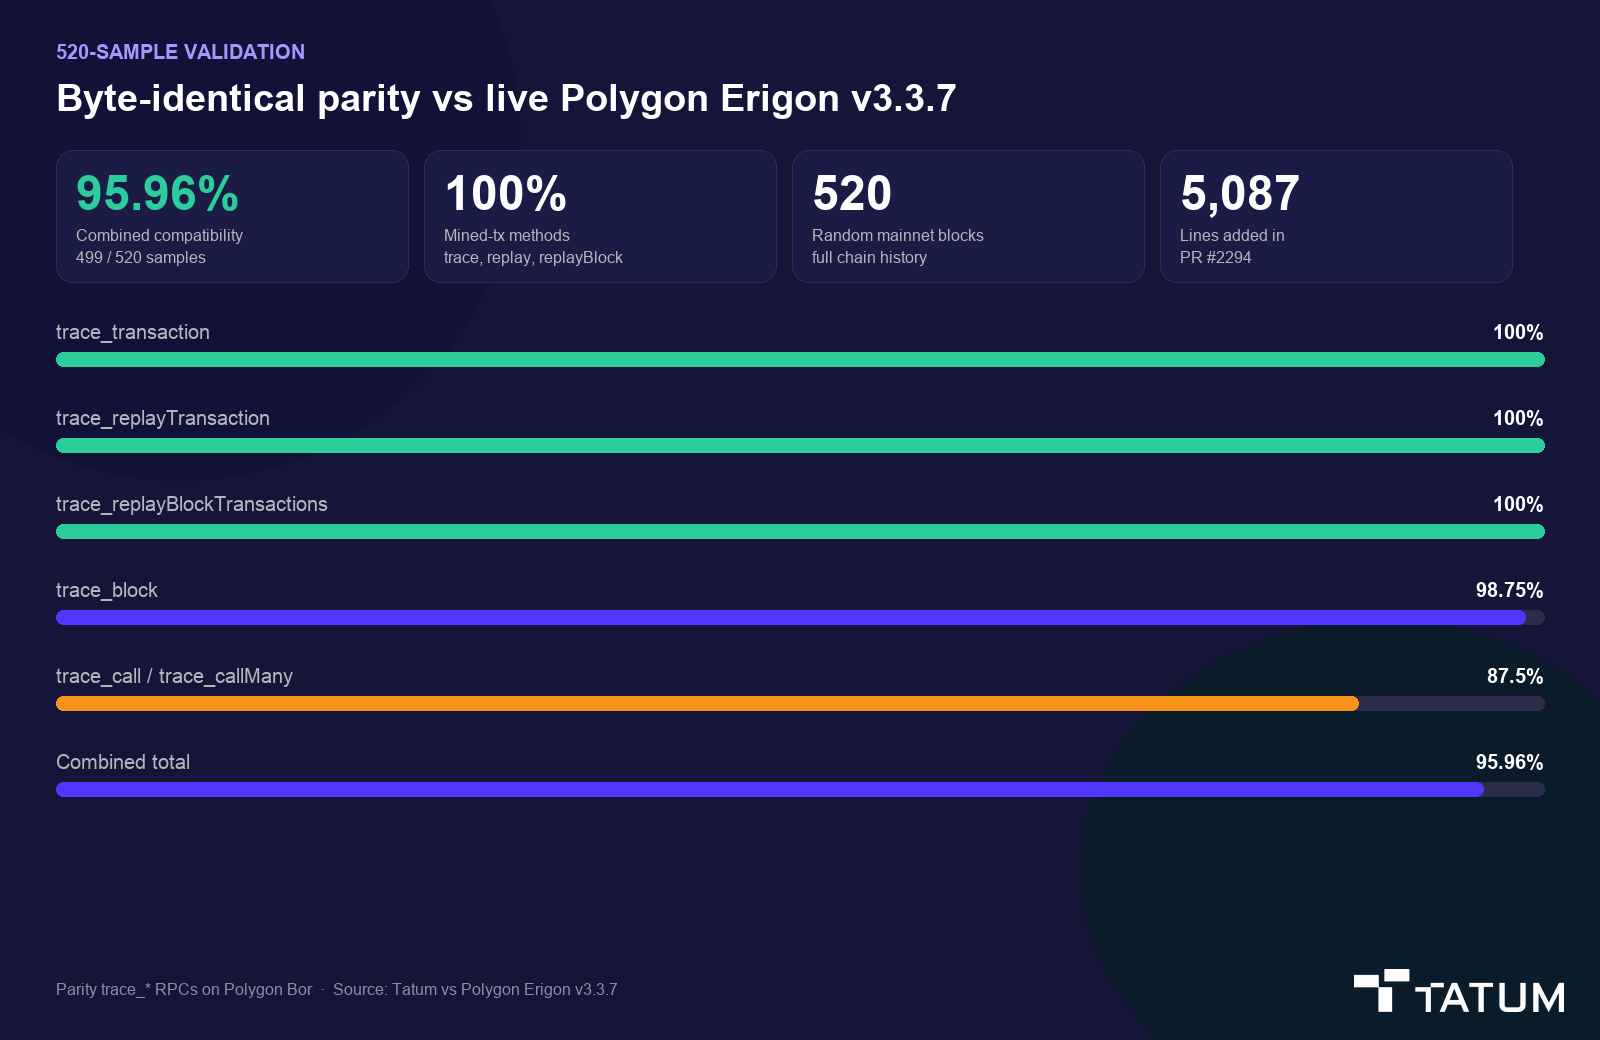
520-sample validation
Byte-identical parity vs live Polygon Erigon v3.3.7
499 / 520 samples
trace, replay, replayBlock
full chain history
PR #2294
| RPC method | Identical | Sample size | Compatibility |
|---|
Click a table row to highlight the matching bar. Combined total is 499 identical responses out of 520.
The remaining 21 minor discrepancies across the 520 samples were traced back to two documented edge cases, not random encoding bugs:
- Pre-Madhugiri state-sync blocks. For historical blocks prior to the Madhugiri upgrade (block 80,084,800 on mainnet),
trace_blockomits the legacy state-sync pseudo-transaction. All modern blocks post-Madhugiri include canonical state-sync transactions properly.vmTracefor a post-Madhugiri state-sync transaction reports an empty ops list because those events execute outside the regular EVM opcode flow. - Gas bailout on underfunded simulations. Erigon automatically injects a simulated temporary balance for unfunded sender accounts during
trace_call. Replicating this behavior in Bor would have required alteringcore/state_transition.go. The team chose not to modify core consensus state-transition rules, keeping the pull request safe and maintainable. Once the sender is funded, gas debit and refund are suppressed to match Parity feeless-sender semantics.
Unit tests run with go test -race ./eth/tracers/.... Table-driven tests cover parity trace conversion, stateDiff encoding (created, deleted, modified, storage), vmTrace push and memory regions, gas accounting, and the feeless sender correction. Manual spot-checks covered SELFDESTRUCT, CREATE revert, precompile calls, and state-sync transactions.
Build on Polygon without rewriting your indexer
Use Tatum's Polygon RPC gateway for mainnet and Amoy, then keep your existing trace_* ingest once Bor archive nodes expose the new namespace.
Getting started: enabling tracing in Bor
Because tracing historical archive state requires significant disk reads and memory, the trace_* namespace is disabled by default and requires an archive node setup (--gcmode archive). The methods themselves already use a 60-second per-phase budget. HTTP write timeout still defaults to 30 seconds, so operators should raise it for deep block replays.
The contribution shipped in Bor v2.9.1-beta. Recommended companion flags:
bor server --config ./config.toml --rpc.enabletrace --rpc.evmtimeout 60s --gcmode archiveYou can also enable the namespace in config.toml and set an adequate HTTP write timeout:
[jsonrpc]
  enabletrace = true

[jsonrpc.timeouts]
  write = "60s"
A typical replay request asks for the three Parity trace types explicitly:
{
  "jsonrpc": "2.0",
  "id": 1,
  "method": "trace_replayTransaction",
  "params": [
    "0xTRANSACTION_HASH",
    ["trace", "stateDiff", "vmTrace"]
  ]
}
If you are migrating off Polygon Erigon, keep using the same method names. For most tracing workloads the Bor responses are byte-identical. Validate the two documented gaps if your indexer still reads pre-Madhugiri blocks or simulates unfunded senders. Range queries via trace_filter are not part of this contribution; those pipelines should use indexed logs or the Data API instead of expecting a drop-in filter method.
Applications that only need transfer trees, not opcode listings, can also keep using Tatum's Blockchain Data API and internal transaction notifications rather than running archive replay themselves.
Strengthening open-source Web3 infrastructure
Building resilient decentralized infrastructure requires active participation in the open-source core clients that support the whole network.
This is the same posture behind earlier Tatum work on Erigon, including the RPC read-lock fix and the recent eth_estimateGas determinism fix. Client diversity only helps if the APIs operators depend on survive a migration.
By contributing native Parity tracing to Bor in PR #2294, Tatum and Polygon have ensured that teams moving from Erigon can retain their existing developer tooling, indexers, and analytics stacks. The consensus engine stayed untouched. The schema indexers already speak is now available on the client Polygon is standardizing on.
If you are building on Polygon today, start with a reliable RPC gateway, keep archive traces on the methods you already call, and treat client migrations as schema problems first. That is the work this pull request was written to remove.